Cluster p-values read as latency/location claims
Symptom. "The effect began at 312 ms" from a cluster test.
1 claim on this page is unverified. TODO(confirm) marks a specific statement the author has not yet checked against a
primary source. Everything else on this page has been reviewed. Treat a marked claim as
provisional and go to the cited source rather than quoting the sentence.
Symptom
A results section reports an onset, an offset, a duration or an anatomical location taken from the extent of a significant cluster: “the effect began at 312 ms”, “the difference lasted 180 ms”, “the effect was localized to parietal electrodes”, “significant over central sites from 300 to 500 ms”. Two clusters are compared by their p-values, as though the smaller p meant the larger effect. A non-significant cluster is reported as evidence that the conditions do not differ. In a replication, the same effect produces a cluster with different boundaries, and the difference is discussed as a latency difference between studies.
Cause
A cluster-based permutation test performs one test of one hypothesis: that the condition labels are exchangeable across the entire tested set of channels and time points. The null distribution is built from the largest cluster statistic found anywhere in each permuted map, which is exactly what makes the single p-value valid over the whole search — and exactly what prevents it from saying anything about any particular point inside the cluster. No point in the map receives a p-value of its own.
The cluster’s extent is therefore a description of one sample under one analysis choice, not an estimate:
- The boundaries are set by the cluster-forming threshold. That threshold is chosen by the analyst; raise it and the cluster shrinks, lower it and neighbouring clusters merge. An onset that moves when an analysis parameter moves is not an estimate of an onset.
- The boundaries are where the point-wise statistic happened to cross the threshold in this sample. The crossing point is noisy, and it is biased: a cluster tends to start where signal and noise happened to agree, which is later than the true onset for a rising effect, so the cluster’s onset is a biased estimate even in expectation. This is the central argument of the cluster-interpretation literature that L3.7 cites (
sassenhagen2019). - Points inside the cluster were not individually tested, and points outside it were not shown to be null. The peak channel is where signal plus noise was largest, which is not a localization.
- A cluster p-value is not an effect size. It depends on extent, on the threshold and on the noise level, so ordering clusters by p orders them by none of the things the reader will assume.
The absence case has the same structure: no surviving cluster means the test did not reject in this space with these subjects, which is not evidence that the conditions are the same.
Detect
- Read the claim back against the test. Any sentence containing an onset, an offset, a duration, a location or a comparison between clusters is not supported by a cluster p-value.
- Move the cluster-forming threshold and watch the boundaries. If the reported onset changes by tens of milliseconds across thresholds you would all have accepted, it is a property of the threshold.
- Check whether the claim needs point-wise inference and whether any was performed. Counting significant points inside a cluster is
pf-uncorrected-timepoint-testsin corrected clothing. - Look for a measurement to support a latency claim: a fractional-area or jackknifed latency with a confidence interval, or a procedure that tests onsets explicitly. If there is none, the latency claim has no test behind it.
- Check that a null result is reported as a null result and not as evidence of equivalence; equivalence needs a test designed for it.
Fix
- Report the cluster as a description, in those words: “the cluster extended over these channels between these latencies, with its largest statistic at …”, followed by the single inferential claim the test supports — that the conditions differ somewhere in the tested space, with the family-wise error rate controlled at α.
- Report the full analysis: the tested space, the point-wise statistic, the cluster-forming threshold and how it was chosen, the channel-neighbour definition, the permutation scheme, the number of permutations, the seed, α and the tails. Report the non-significant clusters too.
- Use a separate, pre-specified analysis for latency or location. A latency measure designed for noisy data (L3.3), a pre-specified electrode contrast, or — where the claim is anatomical — a source analysis with its assumptions stated (Level 5).
- Show the sensitivity to the threshold, or use threshold-free cluster enhancement so the choice is not made at all (L6.1).
- For an absence claim, use an equivalence test or a Bayesian analysis rather than a failure to reject.
- Plot the statistic map with the cluster outlined, not a binary mask, so the reader can see that the boundary is a contour of a continuous surface.
Example
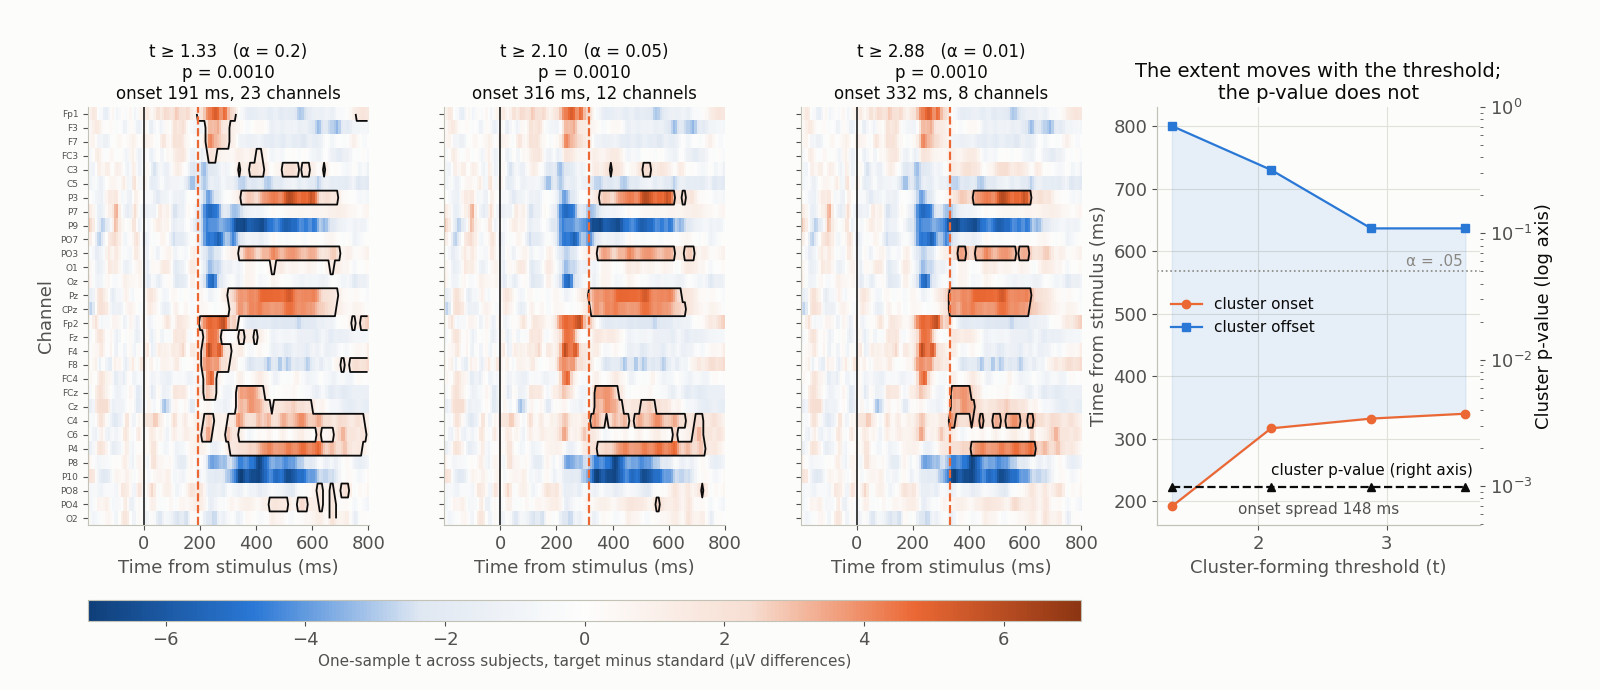
TODO(confirm): caption and numbers, once data/scripts/make_figures_p2.py has written /figures/pitfalls/pf-cluster-inference-misread.png and its sidecar — including the contrast and subjects used, the three thresholds, the cluster onsets and offsets at each, the p-values, the permutation count and the seed. The figure is generated from the same ds-erpcore subject-level difference waves that w-cluster-permutation-viz serves (CC BY 4.0; derived: epoched, baselined, re-referenced, resampled, averaged per subject). The description above states what the mechanism requires the figure to show; the sidecar’s own alt and caption are the authority once it exists.