Rejection that differs by condition
Symptom. One condition loses 30% of trials; effect appears or disappears.
1 claim on this page is unverified. TODO(confirm) marks a specific statement the author has not yet checked against a
primary source. Everything else on this page has been reviewed. Treat a marked claim as
provisional and go to the cited source rather than quoting the sentence.
Symptom
The per-condition trial counts after rejection are badly unequal — one condition keeps most of its trials, the other loses a large fraction. An effect appears, grows or reverses as the rejection threshold moves, while both settings still look like reasonable cleaning. A peak amplitude is larger in the condition with fewer surviving trials. In a group analysis, the subjects with the largest effect are the subjects with the largest trial-count imbalance.
Cause
A fixed rejection criterion is not condition-neutral, because the conditions are not equally likely to trip it. Rare, attended or task-relevant stimuli provoke more blinks and more movement; conditions differ in trial length, in arousal, in how often the participant responds. So the same threshold rejects more trials in one condition than the other.
The consequence is not merely a loss of power. The noise in an average falls as the square root of the trial count, so the two condition averages end up estimated with different precision — and several standard ERP measurements are biased by noise in a direction, not just made imprecise. Peak amplitude is the clearest case: picking the maximum of a noisier waveform returns a larger value, so the condition with fewer trials gets a larger peak for purely statistical reasons (pf-peak-amplitude-noise-bias). A “condition difference” is then a difference in trial counts.
There is a second mechanism on top of the first. Because the threshold is usually chosen while the analyst can see its effect on the result, it becomes an analysis degree of freedom: a small move that improves the effect is very hard to distinguish, from the inside, from a small move that improves the cleaning (L6.4).
Detect
- Build the per-condition rejection table for every subject, every run: trials presented, trials rejected, percentage, and the criterion and channel responsible.
epochs.drop_logholds all of it. - Plot the percentage rejected per condition against the threshold, and look at the difference between the two curves rather than the total.
- Compare the effect computed on the full trial set with the effect computed on count-matched subsamples (seeded). A difference that survives matching is not a trial-count artifact; one that does not, is.
- Report the standardized measurement error per condition (L3.5). Unequal SME across conditions is the quantitative form of this problem.
- Ask the counterfactual: could you have reached a different threshold by looking at the result? If yes, the threshold was not pre-specified.
Fix
- Set the criterion condition-blind: estimate it on pooled trials, never per condition, and fix it before looking at the effect. Pre-specify it alongside the subject-exclusion rule.
- Prefer a data-driven threshold (
autoreject, fitted on pooled trials) to a hand-picked one, and report what it chose. - Report the per-condition rejection table in the QC report and in the paper — not just the total percentage.
- Where the imbalance is large, subsample the better-preserved condition to match the other, with a recorded seed, and report the cost in power. This is a stated choice, not a default.
- Prefer measurements robust to unequal noise: mean amplitude over an a-priori window rather than peak amplitude; and consider correcting or modelling the imbalance rather than hiding it.
- Where the imbalance cannot be removed, report it as a limitation with the per-condition SME, so a reader can judge what it could have done to the effect.
Example
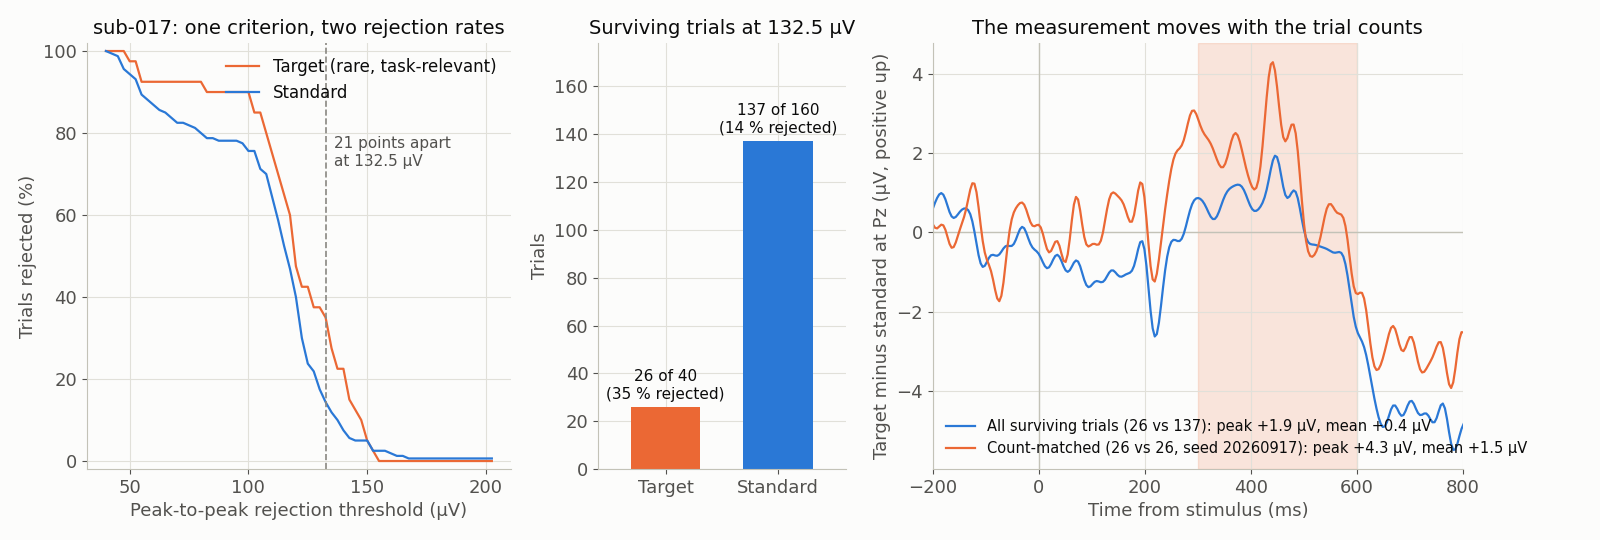
TODO(confirm): caption and numbers, once data/scripts/make_figures_p2.py has written /figures/pitfalls/pf-condition-biased-rejection.png and its sidecar — including the subject, the threshold at which the per-condition rejection percentages diverge by twenty points, the surviving trial counts, and the window means with and without count matching. The figure is generated from the same ds-erpcore P3 epochs that w-threshold-tuner serves (CC BY 4.0; derived: epoched, baselined, resampled). The description above states what the mechanism requires the figure to show; the sidecar’s own alt and caption are the authority once it exists.