Non-sinusoidal waveforms produce spurious coupling
Symptom. PAC between a rhythm and its harmonic.
Symptom
Phase-amplitude coupling is reported between a rhythm and a band at close to an integer multiple of it — 10 Hz phase against 20 Hz amplitude, 6 Hz against 12 or 18 Hz — and it is strong, highly significant against surrogates, and present in most subjects. A comodulogram shows a ridge along the line where the amplitude frequency is twice the phase frequency. The coupling tracks the amplitude of the slow rhythm: it is largest when the slow rhythm is largest, and it disappears when the slow rhythm does. The fast “rhythm” has no peak of its own in a parameterized spectrum, or has one at exactly twice the slow peak that moves with it between subjects and conditions.
Cause
A periodic signal that is not a sine wave has energy at integer multiples of its fundamental. That is not a physiological claim; it is what a Fourier series of a non-sinusoidal periodic function is. Cortical rhythms are routinely non-sinusoidal — a sharper trough than peak, a faster rising flank than falling one, the arch shape the mu rhythm is named for — so a single oscillator generates a fundamental and its harmonics together, in a fixed phase relationship, because they are two descriptions of the same event.
Phase-amplitude coupling measures exactly that relationship. The envelope of the harmonic band rises and falls with the fundamental’s cycle, because the harmonic is part of the fundamental’s cycle, so any coupling measure will find strong, consistent modulation locked to a particular phase. One oscillator produces significant coupling between two bands, and a coupling statistic cannot tell that from two oscillators interacting.
Two things make this hard to catch:
- The usual surrogate does not test it. A phase-randomising surrogate keeps the power spectrum and destroys waveform shape. The harmonic is in the power spectrum, so the surrogate keeps it — but it is no longer phase-locked to the fundamental, so the coupling vanishes and the real value stands far above the surrogate distribution. That is a correct test of something: it establishes that the coupling depends on the waveform. It does not establish a second oscillator; it establishes the confound.
- The statistic has its own biases. Modulation-index measures are biased upward when there are fewer cycles of the phase band in the record, so a comodulogram’s global maximum tends to drift toward slow phase frequencies for reasons that have nothing to do with coupling. A ridge read off an uncorrected comodulogram may not even be at the harmonic.
Sharp transients do the same thing for the same reason. A blink, an electrode pop or a stimulus-locked deflection is broadband and occurs at whatever phase of the slow rhythm it occurs at; enough of them at a consistent phase and the coupling statistic responds.
Detect
- Check the arithmetic first. Is the amplitude band at, or close to, an integer multiple of the phase band? If so, treat harmonics as the leading explanation until it is ruled out.
- Look at the waveform. Plot a few seconds of the raw trace, and a cycle-average of the slow rhythm. A visibly asymmetric waveform with a sharp trough settles the question faster than any statistic.
- Parameterize the spectrum. Ask whether the fast band has a peak of its own, and whether that peak sits at exactly twice the slow peak and moves with it across subjects and conditions. An independent oscillator generally does not track the fundamental that precisely.
- Measure the waveform directly. Cycle-by-cycle rise-decay and peak-trough asymmetry quantify the non-sinusoidality that produces the harmonic (L4.6).
- Test a non-harmonic control band. Coupling between the same phase band and an amplitude band that is not an integer multiple — and that has its own spectral peak — is the specificity check.
- Use a surrogate that breaks the temporal relationship rather than the waveform. Time-shift the amplitude series relative to the phase series by more than one slow cycle, or shuffle trials. That tests the coupling; phase randomisation tests the shape.
- Check whether the coupling simply tracks slow-band amplitude. If it rises and falls with the fundamental’s power, it is a property of the fundamental.
- Check the record length and the number of phase cycles behind each estimate before comparing values across phase frequencies or recordings.
Fix
- Report the waveform alongside any coupling result — a cycle-average of the phase band, and the cycle-by-cycle asymmetry measures.
- Report whether the amplitude band is harmonically related to the phase band, and if it is, either do not make the cross-frequency claim or provide independent evidence of a second oscillator: its own spectral peak, its own time course, its own response to a manipulation.
- Choose the amplitude bandwidth so it can contain the modulation’s sidebands — roughly the phase frequency on either side of the amplitude centre — and state it. A band too narrow filters the effect away before it is measured; a band chosen after looking is a search.
- Use surrogates that test what you are claiming, and say which null each one embodies.
- Consider whether the question needs a coupling measure at all. Where the interest is in waveform shape, measure waveform shape; it is a more direct answer and it does not assert a second oscillator.
- Exclude transients first. Coupling computed on data with blinks and pops still in it is partly about the blinks and pops.
Example
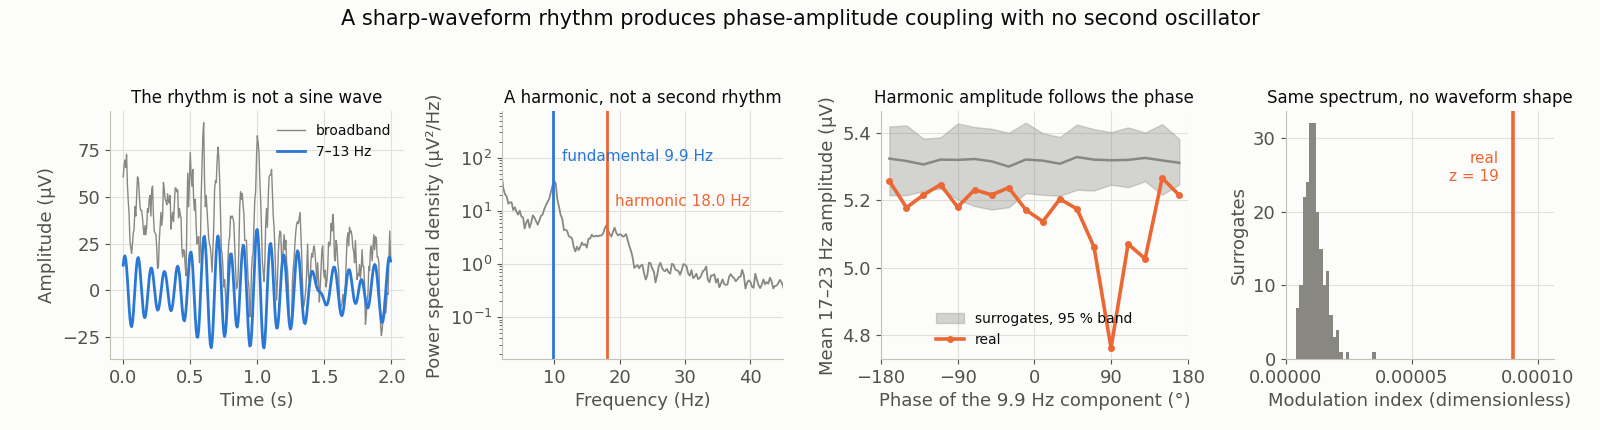
ds-eegbci S011R02 (C4, eyes closed, 160 Hz, 61 s). The rhythm has a fitted peak at 9.89 Hz and a second at 18.03 Hz, which is its harmonic, not an independent oscillator — a non-sinusoidal waveform has to have one. Phase-amplitude coupling between 9.89 Hz phase and 19.8 Hz amplitude gives a Tort modulation index of 9.0 × 10⁻⁵: the amplitude of the harmonic band swings by 9.8 % of its mean across the fundamental’s cycle, while for surrogates it is flat. The index is small because the modulation index always is; what matters is that 200 phase-randomised surrogates — identical power spectrum, identical harmonic, no waveform shape — give 1.2 × 10⁻⁵ ± 0.4 × 10⁻⁵, so the real value stands 19 standard deviations above them and exceeds every one.
Method: Tort modulation index with 18 phase bins (Kullback-Leibler divergence from uniform, normalised by log 18); 4th-order zero-phase Butterworth band-passes; phase and amplitude from the Hilbert transform; surrogates keep the Fourier magnitudes and draw phases from a seeded generator. The recording was selected: of 64 subject-channel pairs across S001–S012 at eight sites that had both an 8–13 Hz peak and a fitted peak within 2 Hz of its second harmonic, the one with the largest surrogate-corrected z was drawn. The selection is stated because it is one — this is the clearest case, not a typical one — and the z is a within-recording comparison, so selecting on it does not make the surrogate test circular.
A comodulogram was computed (phase 4–16 Hz, amplitude 12–45 Hz) and is deliberately not drawn: its global maximum is at phase 4.5 Hz / amplitude 25.5 Hz, not on the harmonic, because the modulation index is biased upward when the phase band is slow and there are fewer cycles in the record. Drawing it under a caption about the harmonic would contradict the picture — and it is its own warning about reading a comodulogram’s maximum as a finding. Generated by data/scripts/make_figures_p3.py. ds-eegbci is ODC-By 1.0, open access, DOI 10.13026/C28G6P; this is a derivative.
The coupling here is real, and it is a property of the waveform. Reporting it as cross-frequency coupling asserts a second oscillator that is not there.