Narrowband filtering creates oscillations
Symptom. Any noise looks rhythmic after a 2 Hz-wide filter.
Symptom
A trace is band-passed to a narrow range and the result is visibly rhythmic: a smooth, regular wave at the band centre, waxing and waning in amplitude. It is presented as evidence that the rhythm exists — often with a figure of the filtered trace, sometimes with burst statistics computed from its envelope, sometimes with the phase used for coupling or coherence. The narrower the filter, the more convincing the picture. No spectrum is shown, or a spectrum is shown on linear axes where a peak could not be seen anyway, and no test for a spectral peak is reported.
Cause
A band-pass filter is an operator that passes a range of frequencies and suppresses the rest. Feed it anything at all — white noise, pink noise, a single step, an artefact — and what comes out is by construction confined to that range, so it oscillates at roughly the band centre. The rhythmicity of a narrowband-filtered trace is a property of the filter, not of the input. The narrower the band, the longer the filter’s impulse response, and the more cycles of apparent rhythm each input sample produces: a filter with a 2 Hz transition needs hundreds of taps at a typical EEG sampling rate, and every sample of the output is a weighted sum stretching a second or more in each direction.
Scalp EEG makes this especially easy to fall into, because its background is not white. The aperiodic component has power at every frequency (L1.7), so there is always something in the band to pass. A band chosen anywhere in the spectrum will return a trace that looks like a rhythm, whether or not the spectrum has a peak there.
The envelope inherits the same problem. The amplitude envelope of filtered noise rises and falls on a timescale set by the filter’s bandwidth, so it produces “bursts” — and thresholding it produces burst counts, durations and duty cycles that look like measurements of a rhythm and are measurements of a filter (L4.6).
The decisive demonstration is a phase-randomised surrogate: take the real recording, keep the magnitudes of its Fourier transform and replace the phases with random ones. The surrogate has exactly the same power spectrum and no waveform structure, no bursts and no temporal relationships at all. Filter it through the same band and it looks exactly as rhythmic as the real trace.
Detect
- Fit the spectrum and look for a peak in the band. Separate the aperiodic component from the periodic peaks (L1.7, L4.6) and ask whether the model departs from its own aperiodic component inside the band. If it does not, there is no rhythm to report there — whatever the filtered trace looks like.
- Filter a phase-randomised surrogate through the identical pipeline and put it beside the real trace, unlabelled. If a colleague cannot tell which is which, the filtered trace is not evidence.
- Check the filter’s length against the timescale you are claiming. If the impulse response is longer than the “burst” you are measuring, the burst’s duration is the filter’s.
- Widen the band and see what survives. A real narrowband rhythm remains visible in a wider band; an artefact of the filter changes character with it.
- Look at the unfiltered trace. A rhythm large enough to report is usually visible, or at least suggested, before filtering. If nothing in the raw trace hints at it, be suspicious.
- Ask where the band came from. A band chosen because the filtered trace looked rhythmic is a search, and the search has to be reported (
pf-post-hoc-windows, L6.4).
Fix
- Test for a spectral peak before reporting anything band-limited. Report the fitted peak’s centre frequency, power and bandwidth, the aperiodic parameters, the fit range, the settings and the fit quality — and if there is no peak, say so and report the band-power result as what it is, a statement about the aperiodic component (
pf-band-power-slope). - Anchor the band on the subject’s own peak where one exists, rather than on a convention, and state the rule used to derive the edges (L4.6).
- Show the filtered trace beside its surrogate whenever a filtered trace is used as evidence.
- Use the widest band the question allows. Narrow filters buy the appearance of rhythmicity, not sensitivity; where a narrow band is genuinely required — for instantaneous phase, say — report the filter fully (type, order, transition band, taps, zero-phase or causal) and treat the phase as defined relative to that band rather than to a rhythm.
- For high-frequency bands, remember the other explanation. Cranial EMG covers the gamma range on the scalp (
pf-muscle-as-gamma), so a peakless band above 30 Hz has two non-neural accounts, not one.
Example
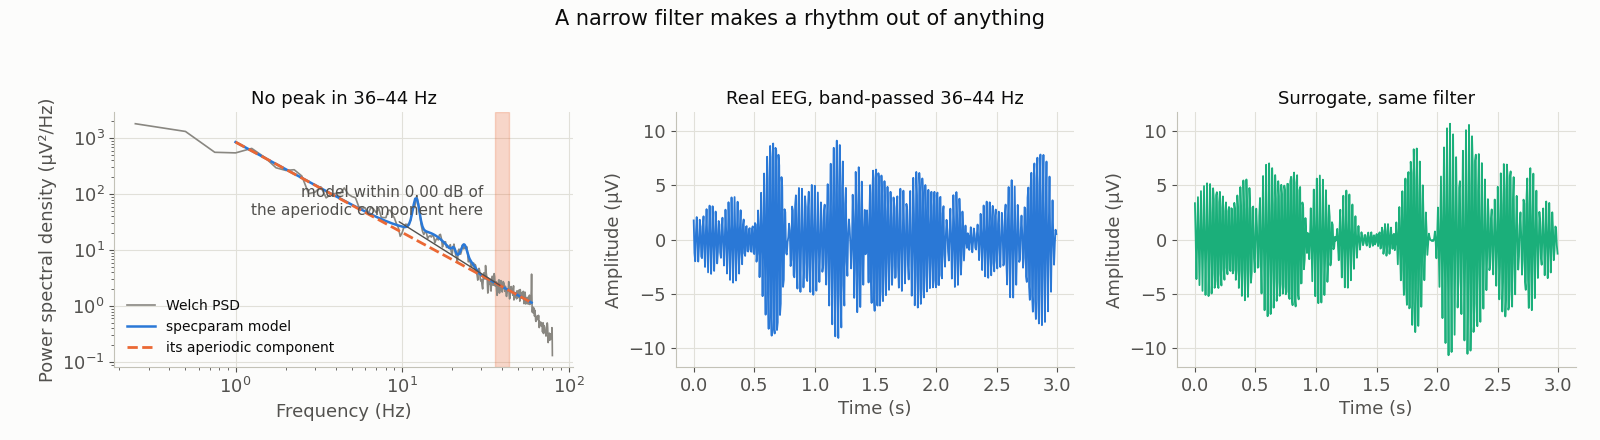
ds-eegbci S001R01 (C3, eyes open, 160 Hz) has no spectral peak between 36 and 44 Hz: the spectral parameterization centres no peak there, and its fitted model stays within 0.00 dB of its own aperiodic component across the whole band (aperiodic exponent 1.613, offset 2.929, model r² 0.980; fitted peaks at 12.2, 15.5, 20.5, 23.6 and 26.0 Hz, none of them in the shaded range). Band-pass it anyway — 4th-order Butterworth, zero-phase — and a rhythm appears. The right panel is a phase-randomised surrogate of the same recording, with the identical power spectrum and every waveform feature and every burst destroyed, and it looks the same.
The band was not assumed: five candidate bands were tried in a fixed order over four recordings and this is the first combination that met the test, with every trial listed in the figure’s sidecar. Spectra by Welch, 4-s Hann segments, 50 % overlap; generated by data/scripts/make_figures_p3.py. ds-eegbci is ODC-By 1.0, open access, DOI 10.13026/C28G6P; this is a derivative — cropped, filtered and, in the right panel, phase-randomised from a seeded generator.
A narrowband-filtered trace is evidence of a filter, never of an oscillation. The evidence for an oscillation is a peak above the aperiodic fit. And since the band here is in the gamma range, note the second reason a filtered trace proves nothing on its own: the scalp carries cranial EMG there.