Comparing amplitudes across references
Symptom. Component at Pz differs by half between studies.
1 claim on this page is unverified. TODO(confirm) marks a specific statement the author has not yet checked against a
primary source. Everything else on this page has been reviewed. Treat a marked claim as
provisional and go to the cited source rather than quoting the sentence.
Symptom
A component’s amplitude does not match the literature: the P3 at Pz is half the published value, or twice it. A topography looks inverted or shifted relative to a published map of the same component. Two studies of the same effect report amplitudes that cannot both be right — and neither is wrong. In a meta-analysis or a multi-site dataset, amplitudes cluster by site rather than by group.
Cause
An EEG channel is a difference: the potential at an electrode minus the potential at whatever the amplifier subtracted. There is no absolute voltage to recover. Changing the reference subtracts a different signal from every channel, so every amplitude changes, and by different amounts at different electrodes.
Two specific mechanisms account for most of the confusion:
- A reference site that carries the component attenuates it. The mastoids are not electrically silent for posterior and temporal generators; Cz sits near the maximum of a P3. Referencing to either shrinks the measured amplitude at Pz, in a way that depends on the generator’s field and so differs between components.
- An average reference depends on the montage. It is the mean over the EEG channels, so it changes with how many channels there are, where they are, and whether the absent online-reference channel was reconstructed. An average over 30 upper-head electrodes and an average over 128 electrodes that reach below the ears are different quantities.
Topographies are affected in a specific and often misread way: subtracting a common signal from every channel shifts the whole map by the same amount at each time point. The gradient — the pattern of differences between electrodes — is untouched; the zero-crossing moves, and a colour scale centred on zero therefore makes the map look different. Reading “the polarity reversed” off such a pair of maps is reading the colour scale, not the physics.
Detect
- Read the methods of both studies for three things: the online reference, the offline reference, and, for an average, the number and layout of channels it was computed over. If any of the three is missing, the amplitudes are not comparable and you cannot make them so.
- Re-reference your own data to the other study’s reference and repeat the measurement. That is the only honest comparison, and it is usually a few lines of code.
- Plot the topography under both references with the colour scale locked. If the gradient is the same and only the zero-crossing moved, the “difference in topography” was the reference.
- Check whether the online reference channel is present in the file. Data recorded against a physical electrode usually ships without it, and averaging over N−1 sites while calling it N biases the average reference.
- Measure the effect on a difference wave as well as on each condition. If the difference between conditions is stable across references while the individual amplitudes are not, the reference-dependence is in the common term, as expected.
Fix
- Fix the reference before looking at the effect, and choose it from the component and the literature you need to speak to — not from which value looks best.
- State all three facts in the methods: online reference, offline reference, and the channel set an average was taken over.
- Reconstruct an absent online-reference channel (as a row of zeros with a montage position) before average-referencing, and carry the rank cost (
pf-interpolation-rank). - When comparing with a literature that used another reference, report your measurement under both, or report a reference-independent quantity — a difference between two electrodes, a current-source-density measure, or a statistic of the scalp distribution — rather than converting a number and hoping.
- Show the map or the effect under a second reference as a robustness check, so a reader can see the conclusion does not depend on the choice.
Example
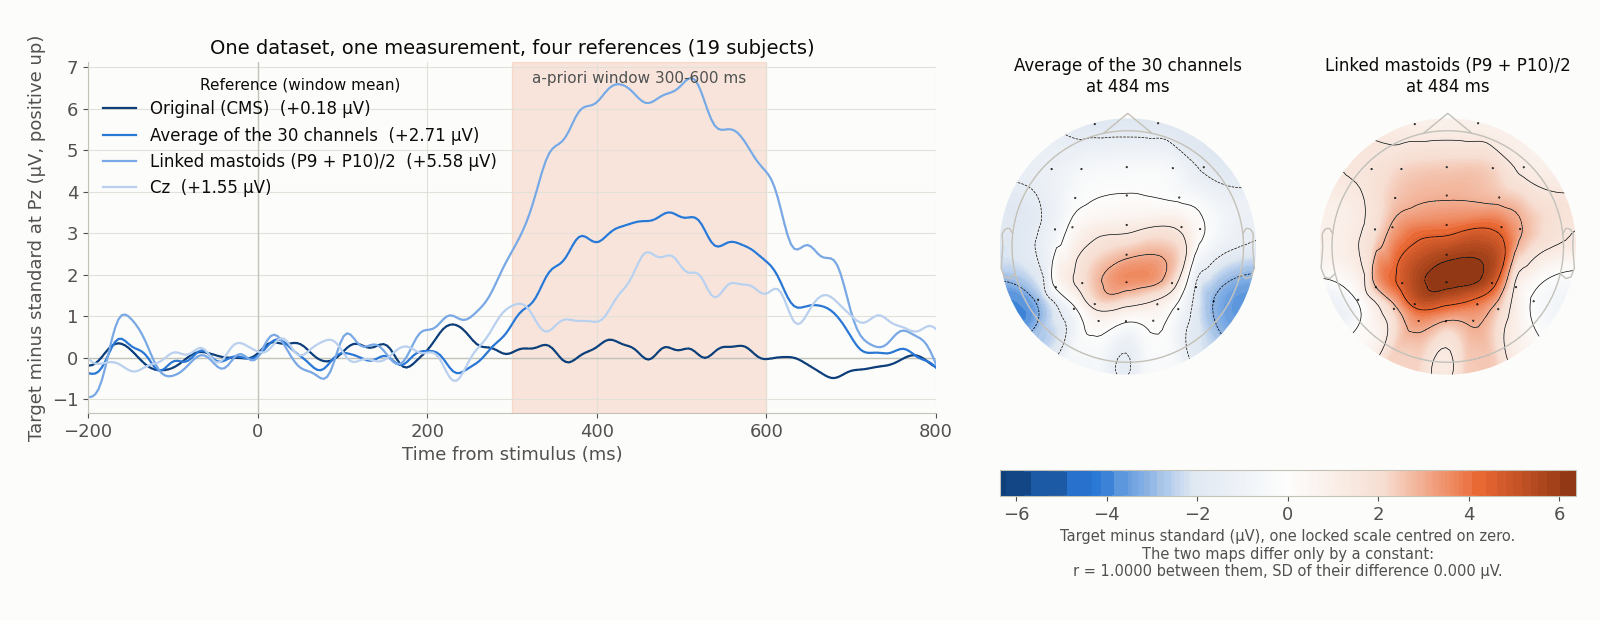
TODO(confirm): caption and numbers, once data/scripts/make_figures_p2.py has written /figures/pitfalls/pf-reference-changes-everything.png and its sidecar. The figure is generated from the same ds-erpcore P3 evoked arrays that w-reference-explorer serves (CC BY 4.0; derived: epoched, baselined, re-referenced); the description above states what the mechanism requires the figure to show, and the sidecar’s own alt and caption are the authority once it exists.