Band power changes that are slope changes
Symptom. "More beta" with no beta peak; all bands shift together.
Symptom
A group, a condition or a time point has “more beta”, “less alpha”, “elevated theta/beta ratio”. Several bands move together, or move in opposite directions on either side of some pivot frequency. No spectral peak is shown in the band that is being reported, or a spectrum is shown but only band-power bar charts are analysed. A “biomarker” built on band power fails to replicate across sites, or tracks age, arousal, medication or amplifier rather than the condition it was meant to measure. Normalizing by total power makes the effect move to a different band instead of making it go away.
Cause
Band power is the area under the power spectrum in a frequency range, and the spectrum is a sum of two things: an aperiodic component, broadband and falling with frequency, described by an offset and an exponent; and whatever periodic peaks sit on top of it (L1.7). Integrating over a band adds both together and reports one number, so three physically different events are indistinguishable in it:
- a genuine change in a rhythm sitting on an unchanged background;
- an unchanged rhythm on a background whose offset moved, which shifts every band in the same direction at once;
- a background whose exponent moved, which raises power at one end of the spectrum and lowers it at the other, pivoting somewhere in between — so two bands can appear to move in opposite directions with no rhythm involved at all.
Only the first is a claim about an oscillation. The aperiodic component is not noise and not a nuisance parameter: it changes with age, with arousal and sleep stage, with anaesthesia and with medication, and it differs between recording set-ups. A band-power difference that is an aperiodic difference is a real difference in the data and a false claim about a rhythm.
Ratios do not help; they usually make it worse. A theta/beta ratio is a two-point estimate of the spectrum’s slope with the rhythms mixed in, so it is more sensitive to the aperiodic component than either band alone, and it is routinely interpreted as though it were about two rhythms. Normalizing by total power removes the offset but not the exponent, and it introduces a dependency of every band on every other one.
The case that makes this concrete: pick a band with no fitted peak in either condition and compare it across conditions. Whatever changes there cannot be a rhythm, because no rhythm was fitted — and it changes anyway, by an amount the aperiodic fit alone predicts.
Detect
- Fit the spectrum, per subject and per condition, and look at the peak list. If no peak has a centre frequency inside the band, do not name the band-power result after a rhythm. Report the fit range, the settings (
peak_width_limits,max_n_peaks,min_peak_height,peak_threshold), the aperiodic mode and the fit quality alongside. - Check whether the “peak” is at the detection floor. A peak whose fitted power sits at the settings’
min_peak_heightand whose bandwidth is at the upper width limit is what the fit returns for a broad, shallow departure from the aperiodic model — not a resonance. - Compare the measured band-power change against the change the aperiodic fit alone predicts. Integrate the fitted aperiodic component over the same band in both conditions and take the ratio. If it accounts for most of the measured change, the result is about the aperiodic component.
- Look for the pivot. Plot both spectra on log-log axes. If they cross at a single frequency and separate in opposite directions on either side of it, you are looking at an exponent change.
- Check whether every band moves together. That is the offset’s signature.
- Watch for instrument explanations. A hardware notch or a low-pass roll-off inside the band changes band power with no physiology at all (
pf-notch-hole-in-band), and a change of amplifier or cap between groups or sessions does the same (pf-site-device-confound).
Fix
- Parameterize the spectrum and report the parameters — aperiodic offset and exponent (and knee where used), and every peak’s centre frequency, power and bandwidth, with the settings and the fit quality. Prefer the peak’s own parameters to band power wherever the question allows: “the alpha peak fell by 0.6 µV² and moved 0.4 Hz lower” is a claim about a rhythm; “alpha power fell” is not.
- If there is no peak, say so and report what the number is. “Power in 36–44 Hz fell by 15 %; no periodic peak was fitted in that range in either condition, so this reflects the aperiodic component, whose exponent changed from X to Y” is an honest and useful result.
- Individualize bands from each subject’s own peak where a peak exists (L4.6), and state that a subject without a peak has no band to individualize.
- Avoid band ratios, or report the aperiodic parameters beside any ratio you are obliged to report.
- Report the aperiodic parameters as findings in their own right. They are often the more interesting result.
- In time-frequency work, remember that a baseline ratio does not rescue you. An ERD in a band with no peak is a change in the aperiodic spectrum over that range, normalized (L4.4).
Example
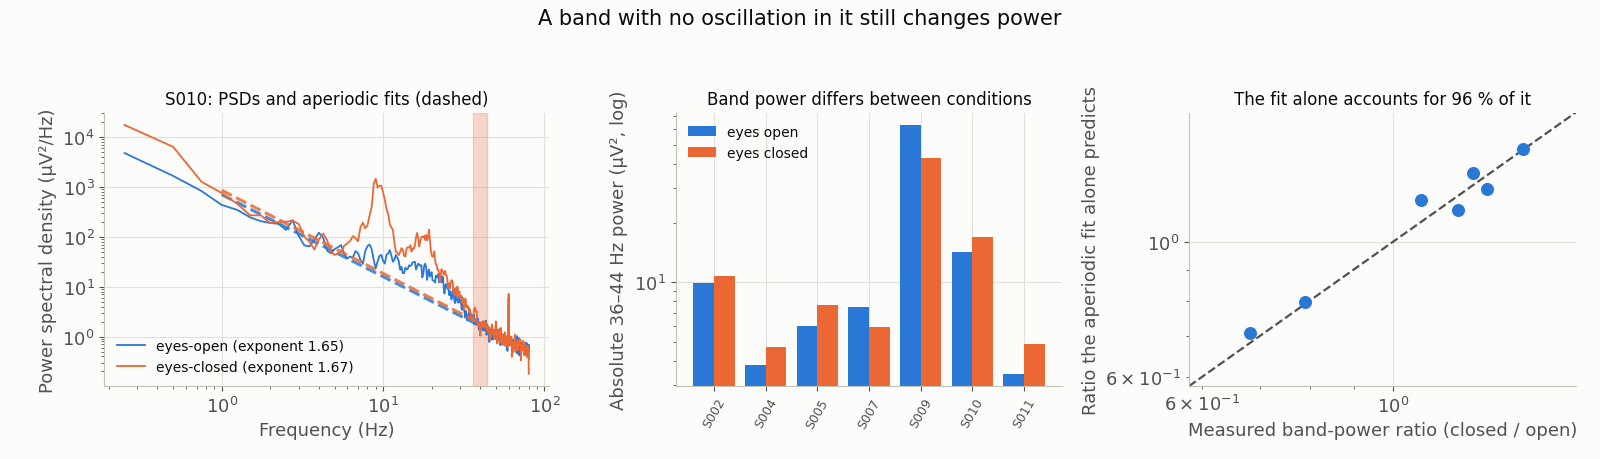
Seven ds-eegbci subjects at O1, eyes open (R01) against eyes closed (R02). The band was chosen by rule rather than assumed: the first of five candidate bands that is peakless in both conditions for at least six subjects and in which the aperiodic fit accounts for at least 60 % of the change — which is 36–44 Hz. The spectral parameterization centres no peak there and its model stays within 1.0 dB of its aperiodic component, so nothing oscillatory in this band changes between the conditions.
Absolute band power changes anyway, by a median factor of 1.19. The aperiodic component alone predicts a factor of 1.17, which accounts for 96 % of the measured change on a log scale. Five of the twelve loaded subjects were excluded because the band is not peakless in both their conditions (S001, S003, S006, S008, S012), and every candidate band’s numbers — including the ones that failed — are in the figure’s sidecar. One of those failures is instructive in its own right: at the very bottom of the fit range (2–4 Hz) the aperiodic estimate is unreliable and band power there tracks it not at all.
Welch, 4-s Hann segments, 50 % overlap; fits over 1–60 Hz with peak_width_limits [1, 8], max_n_peaks 6, min_peak_height 0.1, fixed aperiodic mode. Generated by data/scripts/make_figures_p3.py. ds-eegbci is ODC-By 1.0, open access, DOI 10.13026/C28G6P; this is a derivative. Note that 36–44 Hz on the scalp also carries cranial EMG — which does not affect the figure’s claim, since the point is that a band-power change in a peakless band is not evidence about an oscillation, but is a second reason not to read a change there as neural.
Band power is the area under the whole spectrum in a range, aperiodic part included. A change in it is not evidence about an oscillation unless the aperiodic component has been accounted for.