Aperiodic and periodic components
The 1/f-like background, separating peaks from slope with spectral parameterization, individual alpha frequency, and why band power conflates the two.
Prerequisites: L1.3 · Power spectral density
2 claims on this page are unverified. TODO(confirm) marks a specific statement the author has not yet checked against a
primary source. Everything else on this page has been reviewed. Treat a marked claim as
provisional and go to the cited source rather than quoting the sentence.
Objectives
- Describe the 1/f-like aperiodic background
- Separate peaks from slope with spectral parameterization
- Compute individual alpha frequency
- Explain why band power conflates slope and peak
Why this matters
“Alpha power”, “theta/beta ratio” and “more gamma” are the currency of a large literature, and much of that currency is counterfeit in a specific way: the band integral of a spectrum is dominated by a broadband, sloping background that has nothing to do with any rhythm. Two spectra can differ in “beta power” because one has a beta peak, or because one is tilted, and the number does not tell you which. Separating peaks from the background is a small amount of modelling that changes what you can claim; this lesson does it on real resting spectra and shows you where the claim stops.
Concepts
The aperiodic background
Plot log power against log frequency for any resting EEG spectrum and most of it is a straight line falling to the right. That is the aperiodic (often “1/f-like”) component: power that decreases as a power of frequency, with no preferred frequency. In its simplest form it is described by two numbers:
log10 P(f) = offset − exponent · log10(f),
an offset (the height of the line) and an exponent (its steepness; a spectrum with power proportional to 1/f² has an exponent of 2). Some spectra bend, flattening at low frequencies or steepening at high ones; the model then adds a knee parameter that sets the frequency of the bend. Over the 1–40 Hz range used on this site the fixed (no-knee) form is usually adequate, and the site’s precomputed fits use it unless stated. Typical exponent values for scalp EEG in that range are on the order of one to two (TODO(confirm) the range the author wants quoted).
Periodic peaks
Rhythms appear as peaks rising above the aperiodic line: posterior alpha in the eyes-closed spectrum, mu over central sites, sometimes a beta bump, theta in some states. Each peak is described by a centre frequency (CF), a power above the aperiodic fit (PW, in log10 units) and a bandwidth (BW). A peak is only a peak relative to the background: a bump that vanishes when the line is drawn correctly was a feature of the slope, not a rhythm. This is the practical meaning of “is it really an oscillation?”, which L4.6 takes further.
Spectral parameterization
specparam (the successor of FOOOF; (Donoghue et al., 2020) ) fits both components jointly. In outline: fit an initial aperiodic line to the spectrum; subtract it to leave a flattened spectrum; find the largest peak, fit a Gaussian to it, subtract, and repeat until no peak exceeds a threshold or the maximum number of peaks is reached; refit the aperiodic component to the spectrum with the peaks removed; and combine. The output is the parameter set above plus a goodness of fit (R² and an error term). The settings you must choose and report: the frequency range of the fit (1–40 Hz on this site), the aperiodic mode (fixed or knee), limits on peak width, the maximum number of peaks and the minimum peak height. The site’s precomputed fits behind the widget use a fit range of 1–40 Hz, fixed mode, at most 6 peaks, peak widths of 1–8 Hz, a minimum peak height of 0.1 and a peak threshold of 2.0 (specparam 2.0.0rc4; settings recorded in the asset); the notebook exposes the same settings so you can see what changing them does.
The widget’s “quick fit” is deliberately simpler — a straight line through log power against log frequency outside the peaks — and it shows the precomputed specparam fit beside it as the reference. When the two disagree, the difference is usually the peaks’ influence on the line, which is the whole reason the joint fit exists.
Individual alpha frequency
The individual alpha frequency (IAF) is the centre frequency of a person’s own alpha peak, read from the parameterized eyes-closed spectrum at a posterior channel. It varies across people by a couple of hertz and changes with age and state, so a fixed 8–13 Hz band cuts different people’s alpha differently. Bands anchored on the IAF (for example alpha as IAF ± 2 Hz, with theta and beta defined relative to it; TODO(confirm) the convention the author wants adopted) put the same rhythm in the same band for everyone. Reporting the IAF also makes the alpha peak’s existence explicit: a subject with no detectable alpha peak has no IAF, and averaging a fixed alpha band over such a subject reports background power as rhythm.
Why band power conflates slope and peak
Band power is the integral of the spectrum between two frequencies. Write the spectrum as background plus peaks and the integral splits into two parts: the background’s contribution, which is large in every band and set by offset and exponent, and the peaks’ contribution, which is zero in a band with no peak. A change in the exponent tilts the whole spectrum, so every band’s power changes at once and in a predictable pattern (low bands one way, high bands the other, all together). A change in the alpha peak changes the alpha band and, through the peak’s tails, its neighbours. “More beta power” is therefore consistent with a beta peak, a flatter slope, a higher offset, or a broader alpha peak, and the number alone cannot distinguish them. Relative power makes it worse, because normalizing by total power couples the bands again. The fix is to report the parameters rather than the integrals, or at least both.
Interpretations of the slope (presented as debated)
The aperiodic exponent has been proposed as an index of several things, among them the balance of excitation and inhibition in the underlying population, age-related change, arousal and task state. These are active research questions, and the mappings are not settled: the exponent also depends on the fit range, on the reference, on hardware filtering, on muscle and other broadband artifacts, and on the knee. On this site the slope is a descriptive quantity to be measured and reported; claims about what a slope difference means physiologically are labelled as hypotheses.
Hardware filters and the fit
Everything the amplifier did to the spectrum ends up in the aperiodic fit. A hardware high-pass bends the low end, a low-pass steepens the high end, and a notch punches a hole that the peak finder may read as a negative peak. That is why ds-lemon’s preprocessed release (band-passed 1–45 Hz) is unsuitable for aperiodic fits and the raw release is used; why ds-arithmetic (reported roll-off near 30 Hz, 50 Hz hardware notch) cannot be fitted over the site’s standard range; and why the fit range must be chosen inside the hardware passband and stated (L1.3’s hardware fingerprint again).
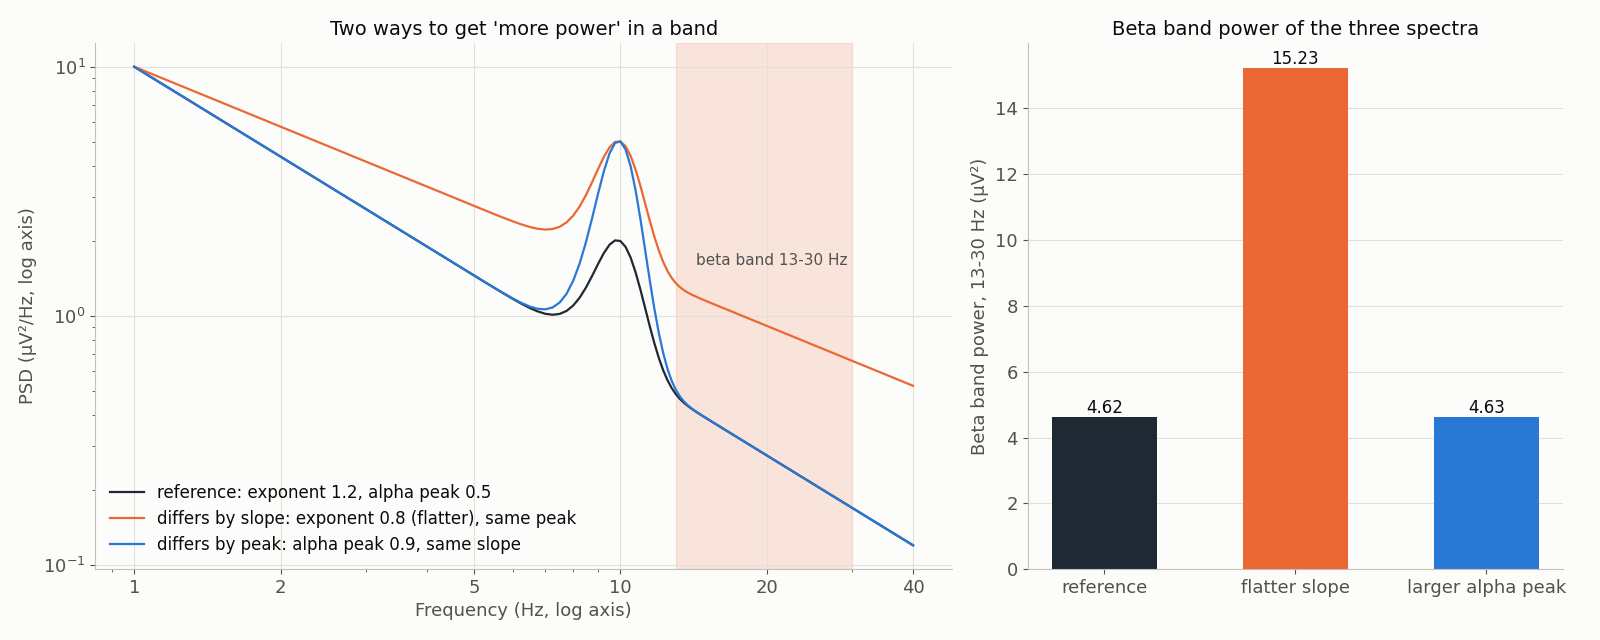
data/scripts/make_figures.py. Before reporting a band-power difference, fit the two spectra and ask which parameter moved. If the exponent differs and there is no peak in the band, you have a slope difference and should say so; if a peak differs, say that; if both, report both. “Band power” without this step is a number whose meaning you have not established.
The data behind this lesson
- The widget’s spectra are Welch PSDs (2-s Hann segments, 50% overlap, raw run) of the
ds-eegbcieyes-open and eyes-closed baselines at O1 for twelve subjects (S001–S012; none of the documented defective subjects is among them), each with a precomputed specparam 2.0.0rc4 fit over 1–40 Hz in fixed mode (ODC-By 1.0; recorded indata/manifest.json). - The notebook fits specparam per subject on eyes-closed PSDs, extracts IAF, exponent and offset, and plots their distributions;
ds-lemonraw is the alternative source. - The figure is synthetic (no dataset), generated by
data/scripts/make_figures.py: a reference spectrum (offset 1.0, exponent 1.2, alpha peak of height 0.5 log10 units at 10 Hz), a slope variant (exponent 0.8) and a peak variant (height 0.9); its sidecar carries the parameters and the beta-band integrals.
Explore

Start with the eyes-closed spectrum of one subject. Drag the exponent until the line matches the background away from the peaks, then add one peak and set its centre on the alpha bump; read the IAF. Press the quick fit and compare with the specparam reference. Then switch to eyes-open and see which parameter moved. In compare mode, put two subjects side by side and find the one whose exponent differs most.
Practice
Aperiodic and periodic components: specparam fits, individual alpha frequency, exponent and offset across ten subjects nb-1-7-specparam
Downloads from ds-eegbci.
The notebook fits specparam to each subject’s eyes-closed PSD, extracts IAF, exponent and offset, plots their distributions across subjects, and shows what a wrong fit range does to the exponent.
Exercises
Exercise ex-1-7-which-has-more-beta
Multiple choiceThe figure above shows a reference spectrum and two variants: one differs from the reference only by its aperiodic slope (neither has a beta peak), the other only by its alpha peak. In the slope comparison, which spectrum 'has more beta power' (13–30 Hz)?
Exercise ex-1-7-why-ill-posed
Free responseExplain why 'which spectrum has more beta power?' is ill-posed, using the reference and its two variants in the figure.
Pitfalls
Band power changes that are slope changes
- Symptom
- "More beta" with no beta peak; all bands shift together.
- Cause
Band power is the area under the power spectrum in a frequency range, and the spectrum is a sum of two things: an aperiodic component, broadband and falling with frequency, described by an offset and an exponent; and whatever periodic peaks sit on top of it (L1.7). Integrating over a band adds both together and reports one number, so three physically different events are indistinguishable in it:
- Detect
- Fit the spectrum, per subject and per condition, and look at the peak list. If no peak has a centre frequency inside the band, do not name the band-power result after a rhythm. Report the fit range, the settings (peakwidthlimits, maxnpeaks, minpeakheight, peakthreshold), the aperiodic mode and the fit quality alongside. - Check whether the “peak” is at the detection floor. A peak whose fitted p…
- Fix
- Parameterize the spectrum and report the parameters — aperiodic offset and exponent (and knee where used), and every peak’s centre frequency, power and bandwidth, with the settings and the fit quality. Prefer the peak’s own parameters to band power wherever the question allows: “the alpha peak fell by 0.6 µV² and moved 0.4 Hz lower” is a claim about a rhythm; “alpha power fell” is not. - If the…
In other tools
In other toolsFieldTrip — names only
The equivalents of what this lesson does, for a reader who works in another toolbox. Function names only: their own documentation is the place to learn how to call them.
FieldTrip
ft_freqanalysis(mtmfft/fooof)FieldTrip
Names checked 2026-09-18 against FieldTrip 20251218.
Reading
- Donoghue et al. (2020). Parameterizing neural power spectra. unverified