A green contact indicator is not a signal
Symptom. Every electrode's contact indicator is green, and the trace under it is mains, muscle or a railed amplifier.
Symptom
The headset’s app shows every electrode green. The stream looks alive — it moves, it has amplitude, the band-power number in the corner goes up and down — and none of it is EEG. On one channel the trace is a 50 or 60 Hz sinusoid with a little noise on it; on another it is broadband hiss that swells whenever the jaw tightens; on a third it is a flat line at the top of the amplifier’s range with a few excursions. Eyes closed changes nothing on any of them. Downstream, a neurofeedback bar tracks jaw tension, a “relaxation score” rises when the participant chews, and a session log records ten minutes of training on a signal that was never the brain.
Cause
A contact indicator is an impedance measurement: the device drives a small current through the electrode and reports whether the return path is low enough. That says the electrode touches skin. It does not say what the electrode is recording. A dry electrode on hair with a good contact reading picks up whatever is largest at that site — mains coupling through a poor reference, the temporalis and frontalis muscles a few millimetres under the skin, or the amplifier’s own saturation when the offset potential drifts past its input range. Impedance and signal content are different measurements; the indicator answers only the first.
Consumer front-ends make the confusion easy. Their quality indicators are computed on the device and documented, if at all, as a colour; the stream they expose may already have a notch applied, which removes the one line that would have given the mains away; and the app’s derived numbers are computed from whatever arrives.
Detect
- Line ratio. Welch power at the mains frequency against the median power 2–8 Hz away. A ratio far above ten on one channel, not shared by its neighbours, is coupling on that electrode, whatever the indicator says.
- High-frequency ratio. RMS in 25–100 Hz against RMS in 1–25 Hz. Muscle raises it; EEG does not. Ask the participant to clench and watch which channel answers.
- Flatness. A window’s standard deviation below half a microvolt, or a run of unchanging samples, is a railed or disconnected channel, and its indicator can be green.
- Eyes-closed reactivity. Ten seconds eyes open, ten seconds closed. Most posterior channels that record EEG show an 8–12 Hz peak rise by several decibels; a channel that records contact and nothing else shows nothing. The test reads in one direction only — at O1 across 30
ds-eegbcisubjects the median rise on ten-second windows is 9.4 dB, but about one subject in five stays under 3 dB, so a null result is not evidence that the channel is not EEG. - Run the live quality gate (L7.12) on the raw stream and read its per-channel labels; run
eegloop checkfor a report with all of the above per channel.
Fix
- Measure quality from the signal, not from the indicator, and gate feedback on what you measured: a channel labelled unusable freezes the display rather than feeding it.
- Reseat the electrode, part the hair, moisten a dry contact; re-check by the signal criteria, not by the colour.
- Keep the device’s own filters off if it lets you, so the diagnostics stay checkable; if it does not, record that the stream arrived notched and that line noise cannot be assessed.
- Never use a vendor’s derived number as the signal (pf-vendor-derived-features); compute the band power from the raw channels and log the parameters.
- Log the quality labels with the session. A session whose channels were unusable for half its length is a fact the analysis needs.
Example
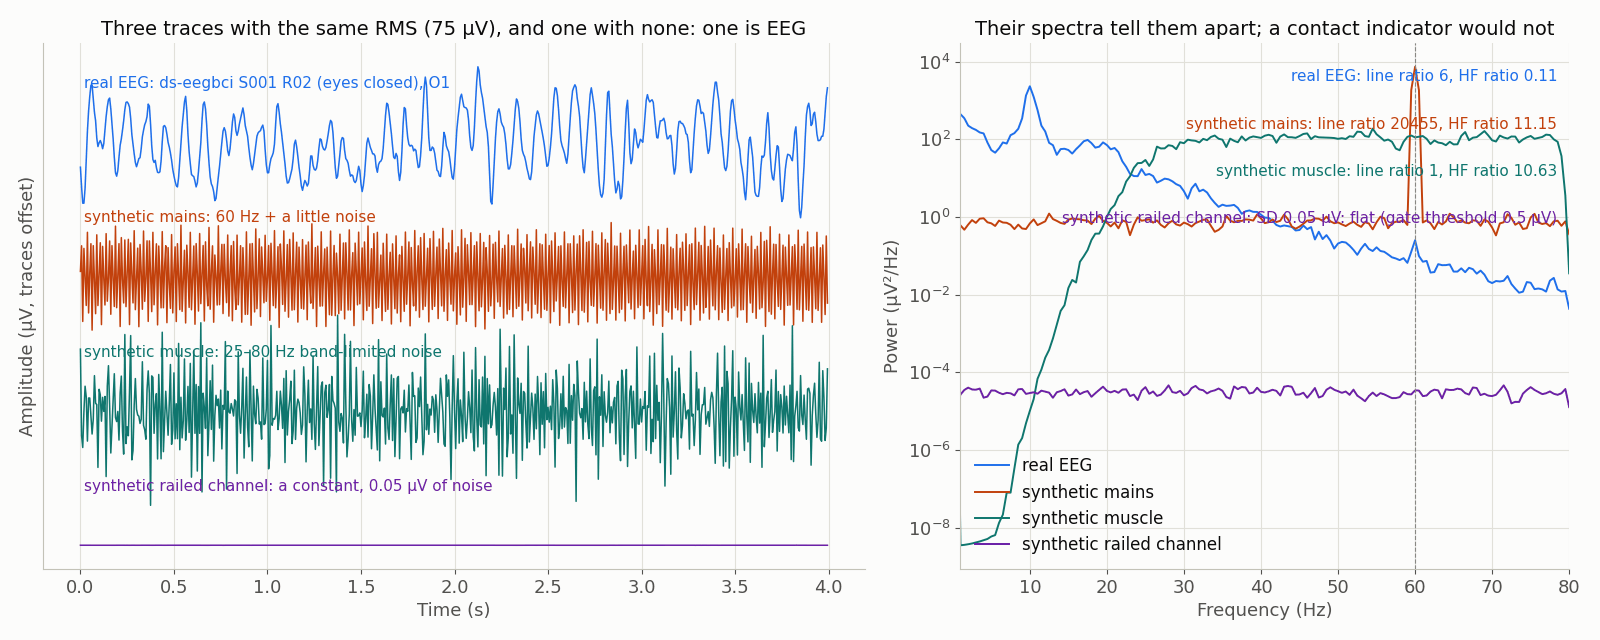
data/scripts/make_figures_p5.py.The real trace is ds-eegbci S001 R02 (eyes closed), O1, 160 Hz, no hardware filters (ODC-By 1.0). The other three are synthetic: a 60 Hz sinusoid and 25–80 Hz band-limited noise, each scaled to the real trace’s RMS so that amplitude alone cannot tell them apart, and a railed channel — a constant with 0.05 µV of noise, the shape the library’s flat_channel scenario plants — whose amplitude a contact indicator cannot see either. The line ratio, the high-frequency ratio and the window SD against the 0.5 µV flatness threshold printed on the right are the numbers the L7.12 gate reads. Generated by data/scripts/make_figures_p5.py.