A vendor-derived column is not the signal
Symptom. A "focus", "calm" or band-power column from the headset's export is used as the feedback signal or as a feature, and nobody can say how it was computed.
Symptom
The export has sixty-seven columns and fourteen of them are electrodes. The rest are the firmware’s opinions — contact quality per electrode, a signal-quality score, motion, and on some devices a band power or a named mental state — and one of them has become the feedback signal, the classifier’s best feature, or the outcome in a report. Asked what it is, the answer is the column’s name. Asked for its window, its filter, its reference, its normalisation and its update rate, there is no answer, because the vendor did not publish one.
Cause
A consumer export is a vendor product, not a raw file with metadata attached. Most of its columns are computed on the device or in its app from the electrodes, through a pipeline whose parameters are proprietary, may change with a firmware update, and may already include a notch, a smoothing and a per-user normalisation that nobody wrote down. A quality score is an impedance-like indicator on the vendor’s own scale; a “focus” number is a band ratio of the vendor’s choosing over the vendor’s window. None of that is wrong for what the app does with it. It becomes a pitfall the moment the column is treated as a measurement: a feedback loop trained on it has a signal nobody can state, and a report that uses it as an outcome cannot say what changed. Worse, quality and state columns correlate with the very artifacts a classifier should ignore, so a pipeline that reads “every numeric column” trains on the firmware’s opinion of the data alongside the data.
Detect
- Can you write the computation down — band, window, filter, reference, normalisation, update rate? If not, it is a vendor column.
- Is the column written on every row, or only when the firmware updates it? A periodic report padded with blanks is not a per-sample signal.
- Does its scale have units? A number from 0 to 100 or 0 to 4 with no unit is a score, not a power.
- Compute the quantity you actually want from the raw channels with a stated method and plot the two side by side; if they disagree in shape, the column was something else.
Fix
- Compute the feedback signal, the features and the outcome from the raw electrode columns, with the band, the window, the filter and the reference stated — L7.13’s
SignalSpecis the shape of that statement — and log the parameters with the session. - Keep the vendor columns as what they are: a description of the device’s own view, useful for reading and never used as truth. Show them next to your computation if they help the reader.
- Never let a quality or state column into a feature matrix; it is a label of the artifact, not a measurement of the brain.
- If the device offers a raw stream and a processed one, record the raw one and say which you recorded.
Example
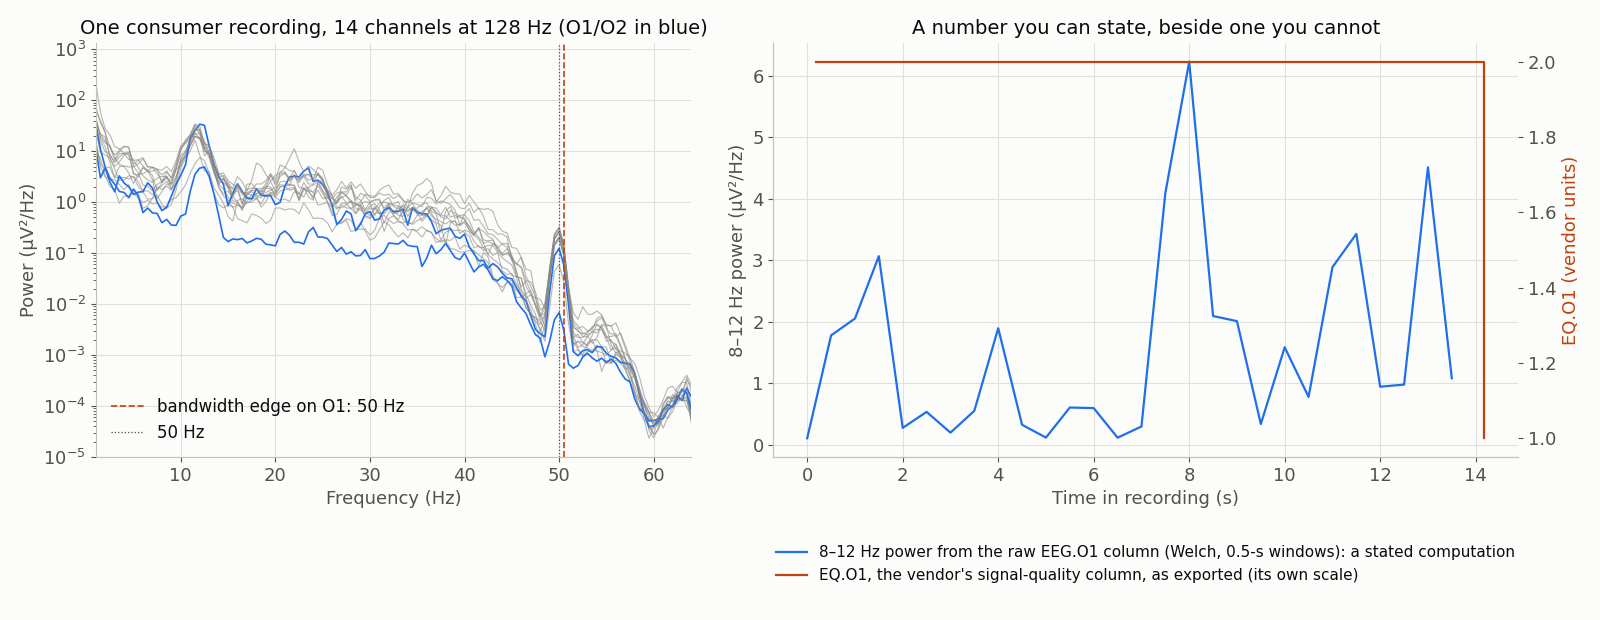
data/scripts/make_figures_p5.py.Real data, no synthetic trace: ds-areeg participant 1 (CC BY 4.0), one recording of the first six — the one in which the vendor’s column was updated most often — fetched by HTTP range request. Left, the Welch spectrum of all fourteen channels with the front-end’s bandwidth edge measured by the library’s report and the 50 Hz mains line marked (line ratio on O1 5.0 at 50 Hz, 0.1 at 60 Hz: the room’s mains, not a notch). Right, an 8–12 Hz power from the raw EEG.O1 column — Welch on half-second windows, a computation anyone can state — beside the vendor’s EQ.O1 column as exported: a periodic firmware report on a unitless scale, written on a fraction of rows and padded with blanks. The column is shown; nothing derives from it. Generated by data/scripts/make_figures_p5.py.