Zero-padding mistaken for resolution
Symptom. Smooth spectrum interpreted as finer resolution.
Symptom
A spectrum plotted on a very fine frequency grid (0.05 Hz points from 2-s segments), read as if it resolved features that fine: a peak frequency reported to two decimals from short segments; two rhythms “separated” at 10.0 and 10.3 Hz on a curve that has one broad hump; “high-resolution” spectra whose methods section gives an nfft far larger than the segment length and never states the segment length. Peak positions that shift between analyses of the same data with different padding.
Cause
Zero-padding appends zeros to a data segment before the FFT, so the transform has more bins. The extra bins interpolate the continuous spectrum of the windowed segment onto a finer grid; they add no information, because the zeros contain none. The resolution of a spectrum — the ability to separate two close frequencies — is set by the length of the data, 1 / T (L1.2): two tones closer than 1 / T remain one peak however many zeros are appended. A padded spectrum looks smooth and finely sampled, which is easily mistaken for finely resolved.
Detect
- Find the segment length (
nperseg, or the epoch length for a single FFT) and compute 1 / T; that is the resolution, whatever the plotted grid spacing is. - Recompute the spectrum with no padding and see whether the “resolved” feature survives.
- Add a synthetic second tone closer than 1 / T to a real trace and check whether the analysis pipeline reports it as separate (it should not).
- Read the methods:
nfftwithoutnperseg(or a padding factor without the data length) has not stated the resolution.
Fix
- State resolution as 1 / T from the data length, and report
nperseg(or epoch length) alongside anynfft. - Use zero-padding for what it does: reading a peak’s location more precisely than the bin spacing when the true peak lies between bins, and producing smooth plots — and say so.
- When a question needs finer resolution, use longer segments (and accept the variance cost, L1.3) or longer epochs; there is no other way.
- When two close components must be distinguished, show that the segment length allows it, not that the grid does.
Example
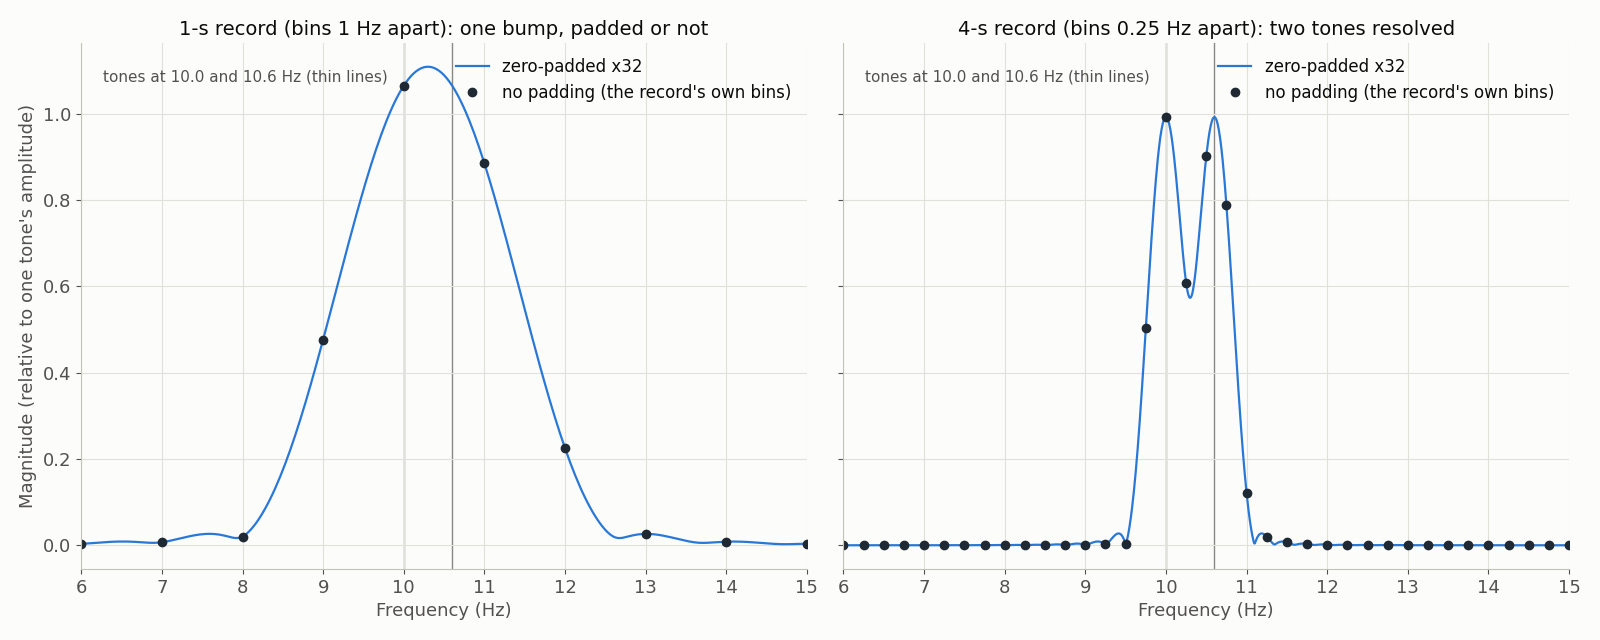
Synthetic (no dataset): two tones 0.6 Hz apart at 160 Hz, Hann window, records of 1 s and 4 s, FFT lengths N and 32 N. Zero-padding the 1-s record gives a smooth curve, not two peaks; resolution is set by the record length (1 / T) and padding only interpolates. The 4-s record resolves them. Generated by data/scripts/make_figures.py (shipped under the site’s CC BY 4.0 terms).